Although changes in the climate can occur naturally, there is a broad scientific consensus that human actions are contributing to climate change and also global warming. Activities that involve the emission of greenhouse gases such as carbon dioxide (CO2) into the atmosphere, predominantly through the burning of fossil fuels for power, are contributing to climate change.
More information regarding climate change, forecasts for the future and adaptation and mitigation measures can be found on the Eryri National Park website.
Data from Eryri contributes proactively to monitoring the effects of climate change, in order to ensure future adaptability.
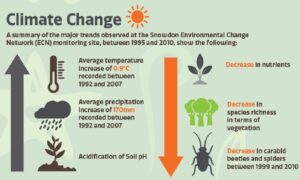
The UK Environmental Change Network (ECN), in conjunction with Natural Resources Wales (NRW), monitors climate change and its potential impacts upon biodiversity, soils and freshwater at a site on Yr Wyddfa.
Annual Average Temperature2 and Rainfall
Eryri has experienced modest changes to the climate evidenced by monitoring on Yr Wyddfa. This has become apparent since the 1960s and 1970s. Spring air temperatures have shown an upward trend whilst winters have become less severe. Soil and grass minimum temperature have also both risen. Accompanying these changes has been a rise in annual precipitation totals since 1995. The extent of the overall temperature rise since recording started in 1995 have however been reduced by the effects of recent severe winters and because of the year-to-year variations in climate.
In addition, Eryri is one of the areas which contributes to the MONARCH (Modelling Natural Resource Responses to Climate Change) research programme. MONARCH aims to evaluate the impacts of climate change on nature conservation (including wildlife and geomorphological features) in Britain and Ireland. The outcomes of this study will gradually help to build our understanding of the complex interactions between climate change, land cover, species and their habitats.
The MONARCH 3 model was designed to more accurately predict changes at a habitat or community level, by examining a wide range of species and making further improvements to the predictive power of the modelling process. One such species of relevance to Eryri was Black Grouse (Tetrao tetrix).
Results indicate that there have been recent recoveries in Black Grouse populations in north Wales due intervention and improved management of upland areas by various agencies such as Natural Resources Wales and the RSPB.
Source: Lloyd, D.S., Turner, A.J., Skates, J. Easter, J. and Bowmaker, V. (2011) Yr Wyddfa Snowdon Environmental Change Network: 15 years of monitoring on Yr Wyddfa/ Snowdon. Countryside Council for Wales, Bangor.
2 For a given location the averages of daily maximum and minimum temperature for a single month for many years give mean daily maximum and minimum temperatures for that month. The average of these values is the mean monthly temperature. Monthly means, averaged through the year, give the mean annual temperature.
3 Ellenberg N values estimate the position along a productivity/macro-nutient availability gradient at which a species reaches peak abundance. The Ellenberg N Index consists of allocating a N score to each plant species, so that the overall mean score for the community lies on a scale of nutrient poor (1) to nutrient rich (10)Calculating mean values for sampled vegetation allows spatial or temporal changes in productivity to be inferred. Many calibration studies support the reliabilit y of these values in signal detection, but attributing change to a specific cause is difficult because the N values integrate a range of effects.
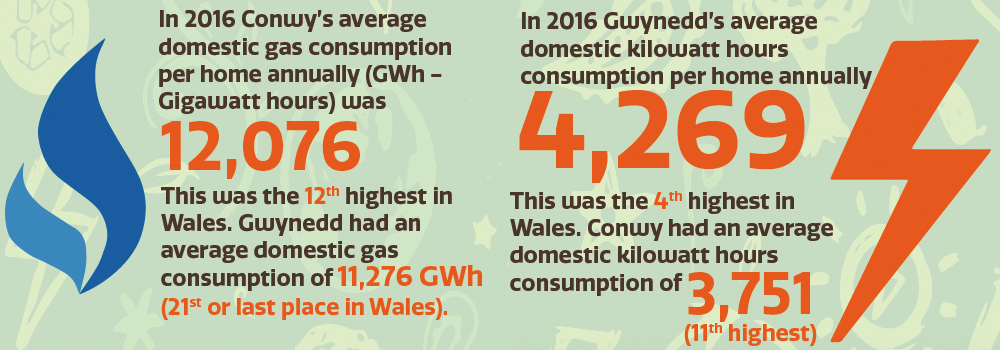
Energy Consumption
Energy efficiency is one means of combating climate change. By using energy more efficiently and reducing demand for energy in our homes we can, not only save money, but go some way to reducing greenhouse gas emissions from electricity generation.
A detailed breakdown of domestic gas and electricity consumption within the National Park is not available. However figures are available for Conwy and Gwynedd.
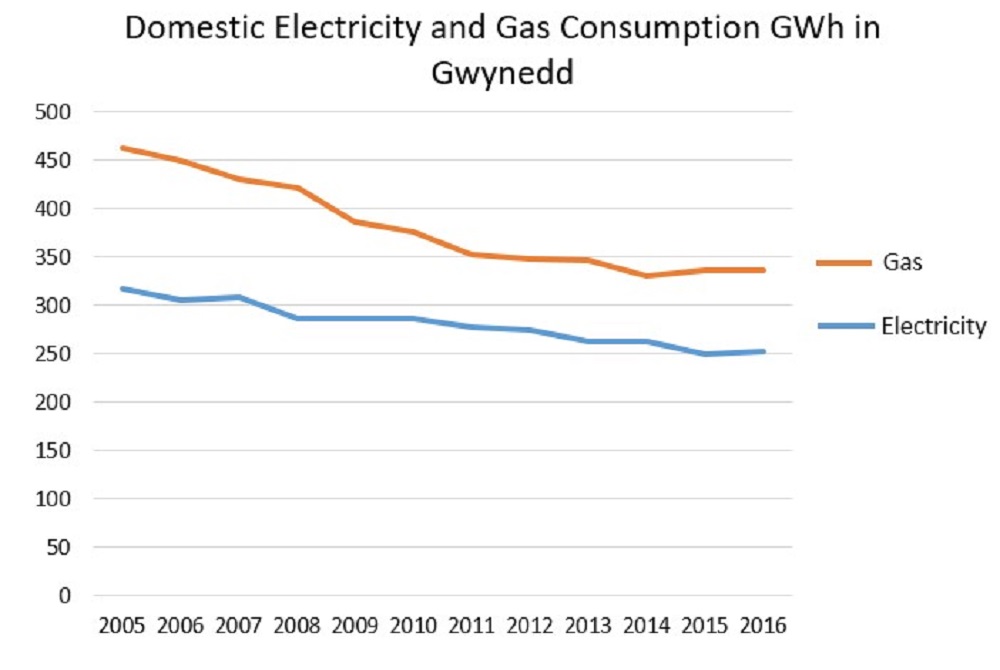
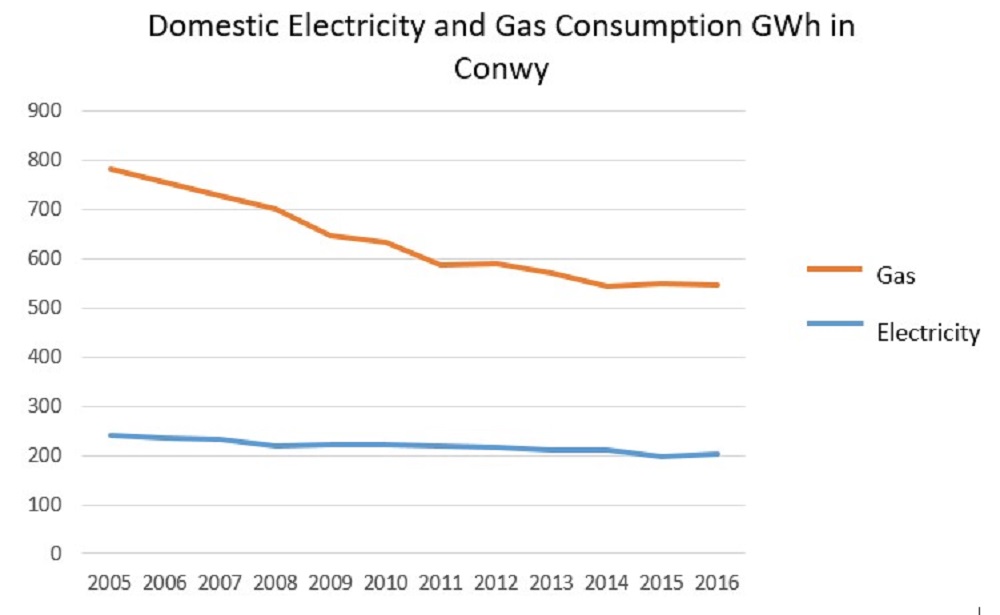
Sources: Domestic Energy Consumption (InfoBaseCymru)
Whilst gas consumption in both Gwynedd and Conwy are below, the national average, domestic electricity consumption in Gwynedd and Conwy are higher than the national average. This is probably due to a number of factors including climate, age of properties and the greater use of electricity for heating properties off the gas grid.
Another means of showing domestic energy consumption is the Housing Eco- Footprint. The Housing Eco-Footprint measures the impact of fuel emissions from direct household energy use for heat, hot water, lighting and electrical appliances as well as the impact from household maintenance and from household construction.
Housing Eco-Footprint
The Housing Eco-Footprint for Wales in 2008 was predicted to be 1.45 gha/capita4. Both Conwy and Gwynedd are predicted to have a Housing Eco-Footprint of 128 – 1.33 gha/capita.
Source: Wales’ Ecological Footprint Scenarios to 2020. Stockholm Environment Institute 2008.
4 gha/capita: Footprint per capita is measured in global hectares. A global hectare is a hectare with world-average ability to produce resources and absorb wastes.
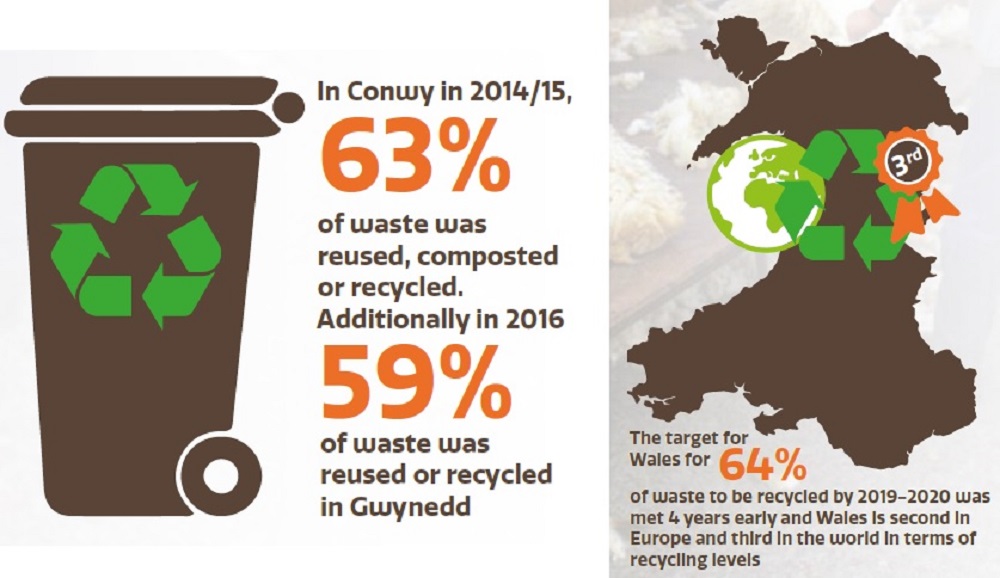
Waste Recycled
Reducing waste generation and re-using, recycling and recovering energy from waste conserves raw materials, reduces emissions and saves energy. It is an integral component of living sustainably development and contributes to combatting climate change.
Most of the waste generated within the National Park is treated and disposed of outside the Park boundary. With Local Authorities set challenging targets by Welsh Government on waste re-use and recycling rates and reducing landfill to zero, performance shows year on year improvement.
Percentage of Waste Reused/Recycled/Composted 2014 to 2016
Household Recycling 2014͏/15
Gwynedd: 20.5%
Conwy: 24.3%
Household Recycling 2015/16
Gwynedd: 20.8%
Conwy: 25.5%
Household Composting 2014/15
Gwynedd: 0.4%
Conwy: 0.3%
Household Composting 2015/16
Gwynedd: 0.3%
Conwy: 0.3%
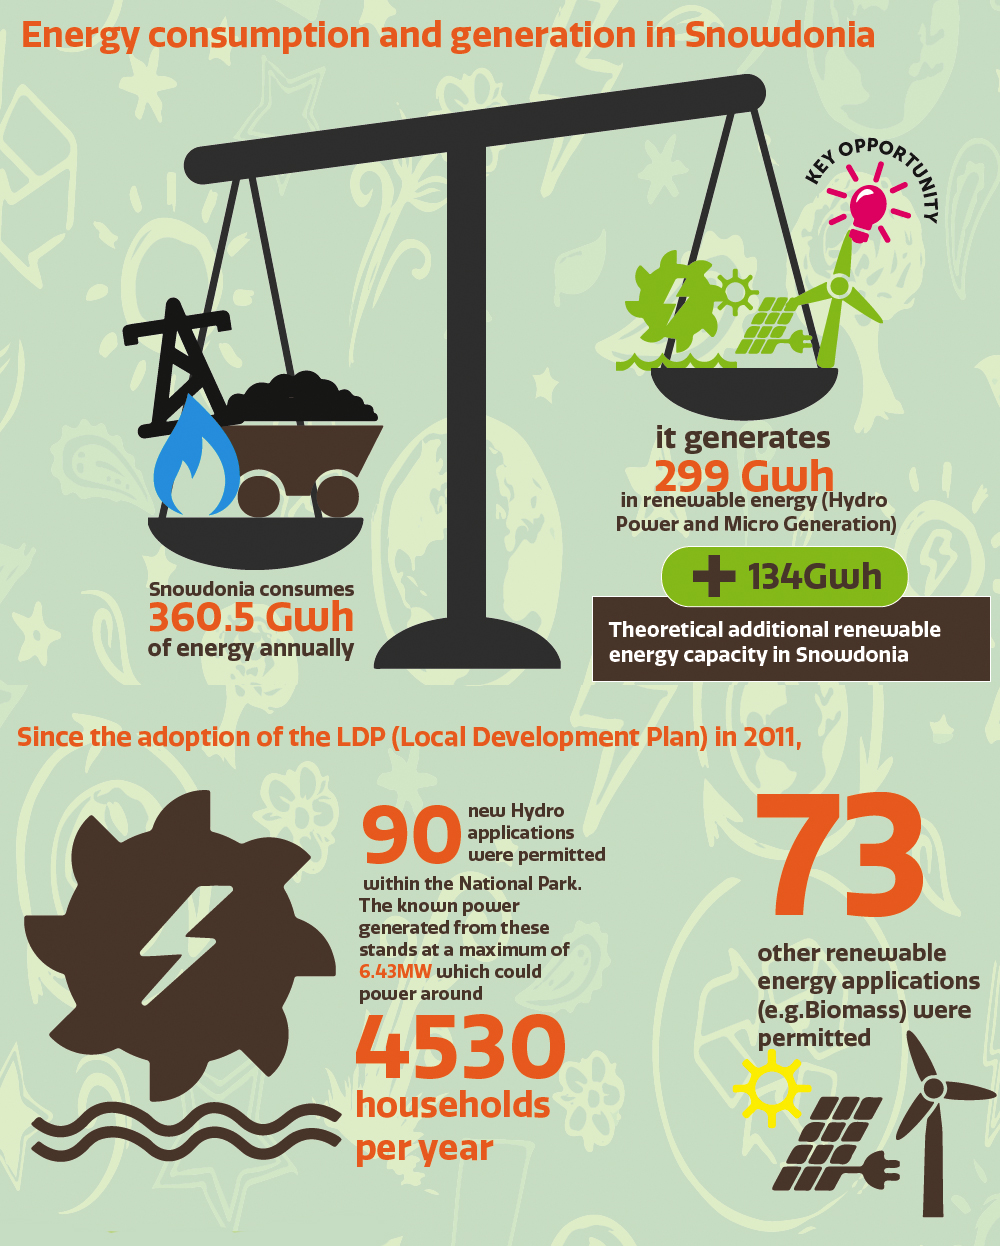
Renewable Energy
To fight against climate change we need a continuous decrease in carbon dioxide emissions and other greenhouse gasses. One way of doing this is to decrease the use of fossil fuels that generates electricity and move towards other forms of renewable energy sources. Eryri National Park is playing it’s part to achieve this aspiration.
Even though not all renewable energy sources is appropriate in designated landscapes such as Eryri, the map at the bottom shows all applications that were granted planning permission since the implementation of the Eryri LDP (July 2011 to June 2015). 136 applications were granted during this time.
The infographic below shows the number of new renewable energy applications that were granted since the implementation of the LDP.