Population
Data from the 2011 Census indicates that in the past 10 years, the population of Wales has increased by 5.5%. In the same time period the population of Eryri National Park has increased by 0.86%.
Eryri has a small population relative to its area, reflecting the rural characteristics. The population has lower levels of young people and higher proportions of both older residents and of non-Welsh residents than for Wales as a whole. Some key indicators for the National Park’s population are sourced from the 2011 National Census and 2013 mid-year estimates.
2011 Census Population Statistics
Population Eryri National Park: 25,702
Population Wales: 3,063,456
Percentage Males Eryri National Park: 49.8%
Percentage Males Wales: 49.1%
Percentage Females Eryri National Park: 50.2%
Percentage Females Wales: 50.9%
2001 Census Population Statistics
Population Eryri National Park: 25,482
Population Wales: 2,903,085
Percentage Males Eryri National Park: 49.0%
Percentage Males Wales: 48.4%
Percentage Females Eryri National Park: 51%
Percentage Females Wales: 51.6%
Mid-year estimates
The 2013 mid-year estimates saw experimental figures compiled for the National Park area. The table below shows the results for the National Park as well as to an UK, Wales, Gwynedd and Conwy level.
All ages
UK: 64,105,700
Wales: 3,082,400
Gwynedd: 121,900
Conwy: 115,800
Eryri: 25,502
Children 0−15 years old
UK: 12,058,700
Wales: 555,200
Gwynedd: 20,900
Conwy: 19,000
Eryri: 3,733
Working age 16−64
UK: 40,915,200
Wales: 1,926,600
Gwynedd: 74,300
Conwy: 67,100
Eryri: 14,804
Over 65
UK: 11,131,800
Wales: 600,600
Gwynedd: 26,700
Conwy: 29,800
Eryri: 6,965
Migration
Inward and outward migration in Gwynedd and Conwy (2015/2016)
0–29 years old
Moved into the area: 5,550
Moved out of the area: 5,810
30–34 years old
Moved into the area: 1,590
Moved out of the area: 1,490
45–64 years old
Moved into the area: 2,100
Moved out of the area: 1,340
Age Structure
Eryri
0–18 years old: 17.2%
18–24 years old: 6.4%
25–29 years old: 4.4%
30–44 years old: 15.4%
45–59 years old: 22.2%
60–64 years old: 9.1%
65+ years old: 25.2%
Wales
0–18 years old: 20.6%
18–24 years old: 9.7%
25–29 years old: 6.1%
30–44 years old: 18.6%
45–59 years old: 19.9%
60–64 years old: 6.7%
65+ years old: 12.3%
Average age
Eryri: 44 years old
Wales: 38.6 yeas old
Wales as a whole has an ageing population with those over 65 expected to rise to almost 26 by 2033. In the National Park, this difference in age structure is particularly accurate.
The graph below shows the age structure of the National Park’s population according to the 2001 and 2011 census. There are numerous changes to be seen between the 2001 census age structure and the results from the 2011 survey.
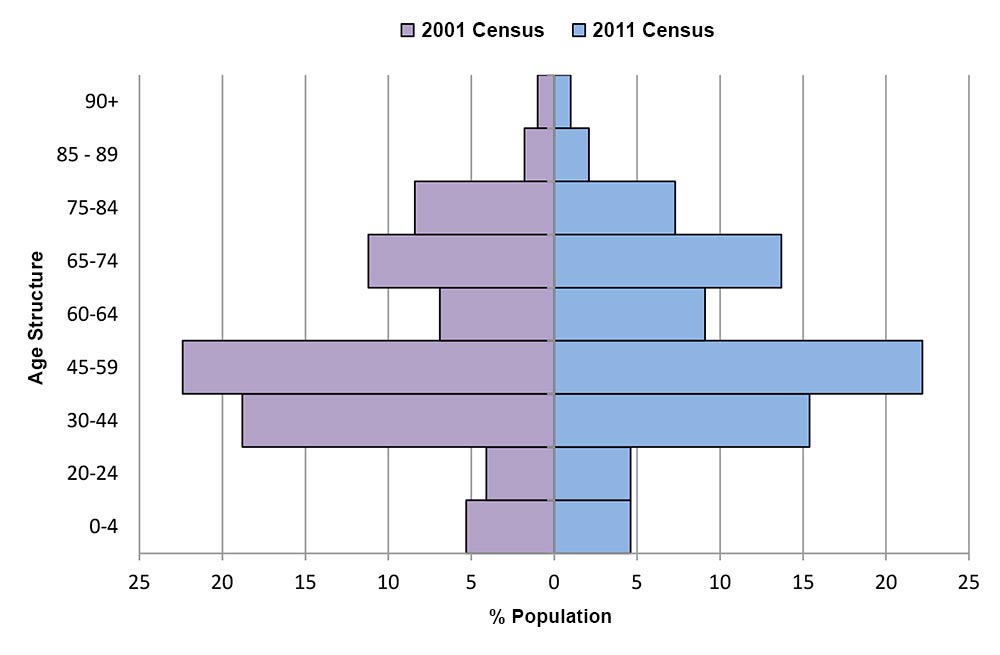
Age Structure
By 2011, there was an increase in the number of older people living within the National Park.
The percentage of children aged between 0-4 years old (4.6%) was less than in 2001, and also less than the Welsh percentage of 5.8%. There was also a decrease in the percentage of people aged 30-44 years old by the 2011 census.
Taken as a whole, the percentage of people aged over 60 is higher in the 2011 census than in 2001.
Economic Activity
The infographic below offers a summary of some of the key economic data for Eryri National Park.
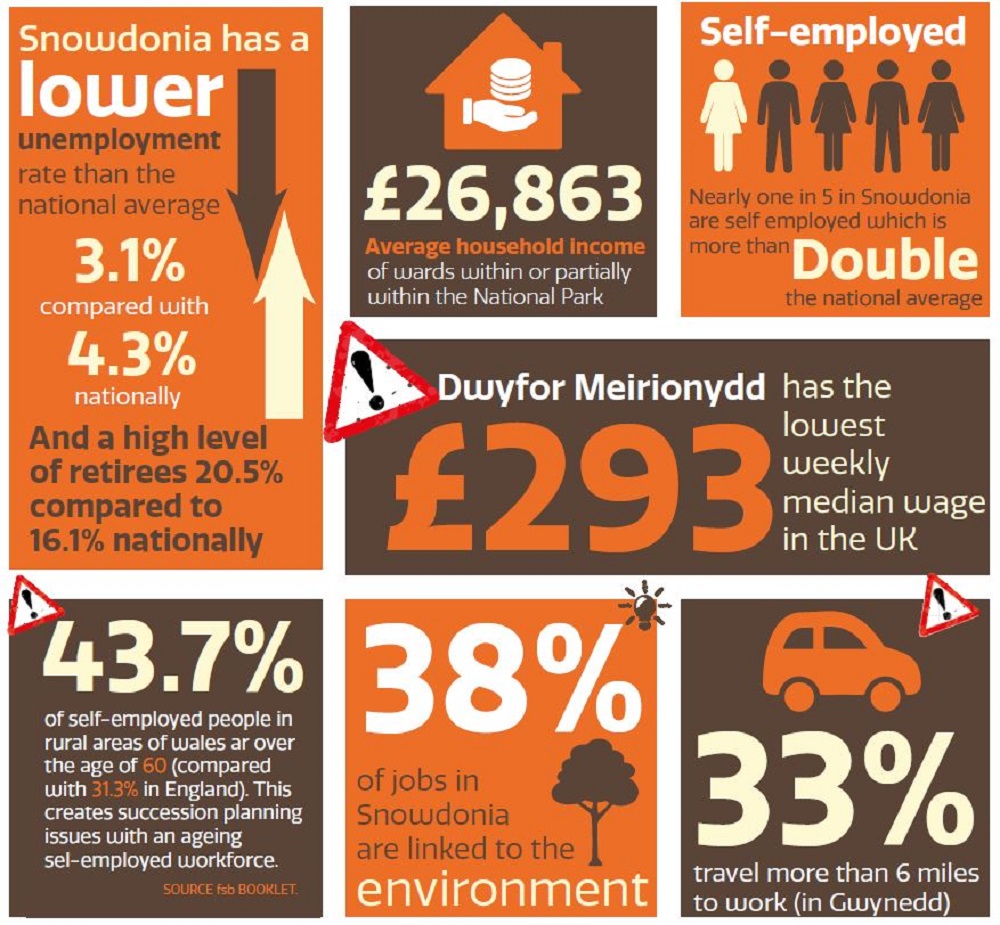
The percentage of economically active people in the National Park who are self- employed is 10.2% higher than the national average. This trend is also true for the percentage of people who are retired within the Park. This is 4.4% higher than the national average and also 2.3% higher than the 2001 census. The National Park also has a lower percentage of people with full time jobs in comparison with the national percentage. The table below shows a breakdown of economic activity within the National Park and compares the data with 2001 figures as well as national percentages.
Economic activity within the National Park
Economically active: Part-time Employee
Actual number: 2,547
SNPA 2001 Census: 13.5%
SNPA 2011 Census: 11.6%
Wales 2001 Census: 11.3%
Wales 2011 Census: 13.9%
Economically active: Full-time Employee
Actual number: 5,660
SNPA 2001 Census: 30%
SNPA 2011 Census: 29%
Wales 2001 Census: 36.2%
Wales 2011 Census: 35.6%
Economically active: Self-employed
Actual number: 3,557
SNPA 2001 Census: 18.8%
SNPA 2011 Census: 17.7%
Wales 2001 Census: 7.7%
Wales 2011 Census: 8.6%
Economically active: Unemployed
Actual number: 583
SNPA 2001 Census: 3.1%
SNPA 2011 Census: 3.5%
Wales 2001 Census: 3.5%
Wales 2011 Census: 4.3%
Economically active: Full-time Student
Actual number: 356
SNPA 2001 Census: 1.9%
SNPA 2011 Census: 1.4%
Wales 2001 Census: 2.3%
Wales 2011 Census: 3.3%
Economically inactive: Retired
Actual number: 3,881
SNPA 2001 Census: 20.5%
SNPA 2011 Census: 18.2%
Wales 2001 Census: 14.8%
Wales 2011 Census: 16.1%
Economically inactive: Student (including full-time students)
Actual number: 674
SNPA 2001 Census: 3.6%
SNPA 2011 Census: 3.8%
Wales 2001 Census: 6.4%
Wales 2011 Census: 6%
Economically inactive: Looking after home or family
Actual number: 573
SNPA 2001 Census: 3%
SNPA 2011 Census: 5.8%
Wales 2001 Census: 9.2%
Wales 2011 Census: 3.8%
Economically inactive: Other
Actual number: 369
SNPA 2001 Census: 2%
SNPA 2011 Census: 3.1%
Wales 2001 Census: 3.5%
Wales 2011 Census: 2%
Unemployed: 16–24 years old
Actual number: 166
SNPA 2001 Census: 0.9%
SNPA 2011 Census: 0.7%
Wales 2001 Census: 1%
Wales 2011 Census: 1.4%
Unemployed: 50–74 years old
Actual number: 146
SNPA 2001 Census: 0.8%
SNPA 2011 Census: 1%
Wales 2001 Census: 0.6%
Wales 2011 Census: 0.7%
Unemployed: Never worked
Actual number: 59
SNPA 2001 Census:0.3%
SNPA 2011 Census: 0.2%
Wales 2001 Census: 0.3%
Wales 2011 Census: 0.7%
Long-term unemployed
Actual number: 220
SNPA 2001 Census: 1.2%
SNPA 2011 Census: 1.3%
Wales 2001 Census: 1.1%
Wales 2011 Census: 1.7%
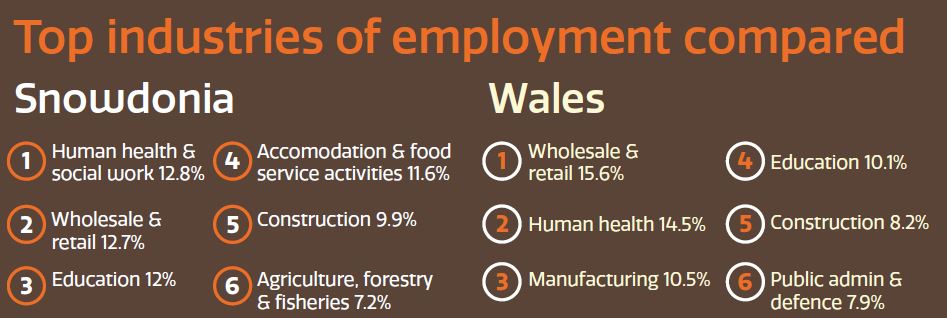
Industry
The infographic below compares the top 6 industries of employment within Eryri, with those of Wales
The figures below give a full breakdown of the industry of employment results from the 2011 census. Due to category changes in the question asked within the 2011 census (in comparison with the 2001 census) only 2011 figures are shown here.
Industry of Employment
All categories: 12,074
A – Agriculture, forestry and fishing
Actual number: 870
SNPA 2011 Census: 7.2%
Wales 2011 Census: 1.7%
B – Mining and quarrying
Actual number: 36
SNPA 2011 Census: 0.3%
Wales 2011 Census: 0.2%
C – Manufacturing
Actual number: 689
SNPA 2011 Census: 5.7%
Wales 2011 Census: 10.5%
D – Electric, gas, steam and air conditioning supplu
Actual number: 111
SNPA 2011 Census: 0.9%
Wales 2011 Census: 0.8%
E – Water supply, sewage, waste management and remediation activities
Actual number: 146
SNPA 2011 Census: 1.2%
Wales 2011 Census: 0.9%
F – Construction
Actual number: 1,199
SNPA 2011 Census: 9.9%
Wales 2011 Census: 8.2%
G – Wholesale and retail trade, repair of motor vehicles and motor cycles
Actual number: 1,532
SNPA 2011 Census: 12.7%
Wales 2011 Census: 15.6%
H – Transport and storage
Actual number: 352
SNPA 2011 Census: 2.9%
Wales 2011 Census: 3.9%
I – Accomodation and food service activities
Actual number: 1,399
SNPA 2011 Census: 11.6%
Wales 2011 Census: 6.2%
J – Information and communication
Actual number: 176
SNPA 2011 Census: 1.5%
Wales 2011 Census: 2.3%
K – Financial and insurance activities
Actual number: 146
SNPA 2011 Census: 1.2%
Wales 2011 Census: 3.1%
L – Real estate activities
Actual number: 154
SNPA 2011 Census: 1.3%
Wales 2011 Census: 1.2%
M – Professional, scientific and technical activities
Actual number: 473
SNPA 2011 Census: 3.9%
Wales 2011 Census: 4.3%
N – Administrative and support service activities
Actual number: 447
SNPA 2011 Census: 3.7%
Wales 2011 Census: 4.0%
O – Public administration and defence; compulsory social security
Actual number: 624
SNPA 2011 Census: 5.2%
Wales 2011 Census: 7.9%
P – Education
Actual number: 1,448
SNPA 2011 Census: 12%
Wales 2011 Census: 10.1%
Q – Human health and social work activities
Actual number: 1,546
SNPA 2011 Census: 12.8%
Wales 2011 Census: 14.5%
R, S, T, U – Other
Actual number: 726
SNPA 2011 Census: 6%
Wales 2011 Census: 4.5%
Some of the percentages seen within Eryri National Park correspond with the national percentages, although there are far less people employed within ‘manufacturing’ in the Park than the national average.
Some industries more important to Eryri National Park, when compared with national averages, are ‘Agriculture, forestry and fishing’ and ‘Accommodation and food service activities’. This highlights the importance of the agricultural and tourism related industries to the area and its role in supporting local employment.
Health
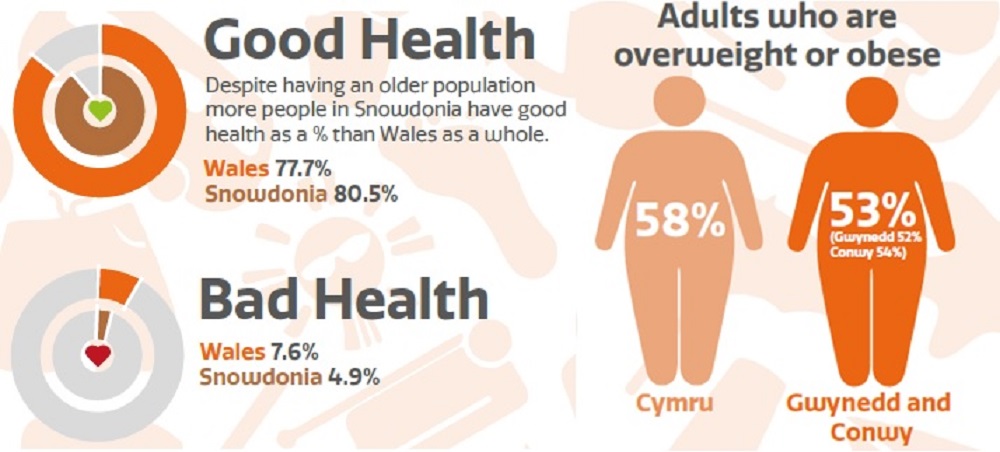
The infographic above shows the difference between those who reported good/very good health in Wales with those who did so within the National Park. It can be seen that more people in Eryri view themselves as having good/very good health in comparison to Wales as a whole. There are also fewer people classed as being overweight or obese in Gwynedd and Conwy in comparison with Wales as a whole.
The table below shows the complete results of the health data gathered during the 2011 census. Snowdonia National Park had a slightly higher percentage of residents with very good health in comparison with Wales (+1.1%), and also had less residents with ‘bad’ or ‘very bad’ health (-2.0% and -0.7% respectively)
Health and Provision of Unpaid Care
All categories: Long-term health problem or disability
Actual number: 25,702
Day-to-day activities limited a lot
Actual number: 2,410
SNPA: 9.4%
Wales: 11.9%
Day-to-day activities limited a little
Actual number: 3,086
SNPA: 12%
Wales: 10.8%
Day-to-day activities not limited
Actual number: 20,206
SNPA: 78.6%
Wales: 77.3%
Day-to-day activities limited a lot: Aged 16 to 64
Actual number: 913
SNPA: 3.6%
Wales: 5.3%
Day-to-day activities limited a little: Aged 16 to 64
Actual number: 1,257
SNPA: 4.9%
Wales: 5.5%
Day-to-day activities not limited: Aged 16 to 64
Actual number: 13,192
SNPA: 51.3%
Wales: 52.7%
Very good health
Actual number: 12,255
SNPA: 47.7%
Wales: 46.7%
Good health
Actual number: 8,419
SNPA: 32.8%
Wales: 31.1%
Fair health
Actual number: 3,752
SNPA: 14.6%
Wales: 14.6%
Bad health
Actual number: 983
SNPA: 3.8%
Wales: 5.8%
Very bad health
Actual number: 293
SNPA: 1.1%
Wales: 1.8%
However the Park had a slightly higher percentage of residents who had their day to day activities limited a little, when compared with national percentages (+1.2%). Due to categorising changes between the 2001 and 2011 censuses, a reliable comparison cannot be made.
Life Expectancy
The table below shows the lifetime expectancy for newborn males and females within Gwynedd and Conwy. The survey was undertaken between 2011 and 2013.
Gwynedd
Male: 79.6 years
Female: 83.7 years
Conwy
Male: 79.1 years
Female: 82.9 years
Unfortunately the data is only available to a County Council level, but it does give some indication of what the life expectancy of the National Park residents would be. In terms of male life expectancy Gwynedd ranks as the 5th highest in Wales with Conwy the 7th highest. The female life expectancy ranks Gwynedd as the 4th in Wales with Conwy the 7th highest.
Housing
Second Homes and Sold House Prices
According to data obtained from the Land Registry’s Price Paid Database, 413 houses were sold within Eryri National Park in 2016.
2016 Houses Sold
Total sold: 413
Detached homes: 162
Semi-detached homes: 78
Flats: 13
Terraced houses: 138
Other: 22
This was slightly higher than the figure seen in 2015 which was 406. The average house price in 2016 was £178,331, whilst the average for 2015 was £174,931.
2015 Houses Sold
Total sold: 406
Detached homes: 182
Semi-detached homes: 78
Flats: 13
Terraced houses: 120
Other: 3
The southern part of the Park (area inc Llangelynin, Bryn-crug / Llanfihangel, Corris/Mawddwy, Tywyn, Aberdyfi) had the highest average sold house price within the Park during 2016 with £217,177. This is considerably higher than the average for the same area in 2015 which was £184,554.
Affordability
Gwynedd and Mon’s PSB Wellbeing Assessment 2017
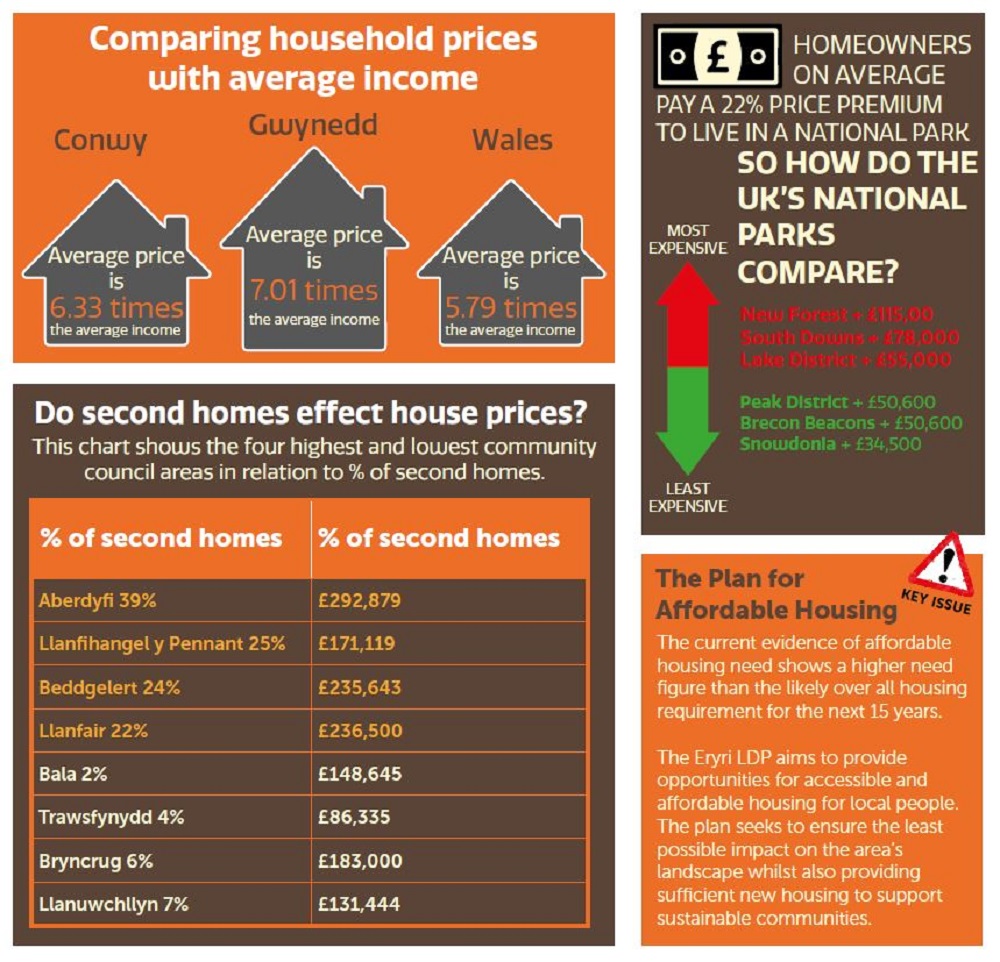
The median property price for Gwynedd of £144,000 is slightly higher than the Wales median of £141,000. The average household income in Gwynedd is £22,240, but £27,714 is needed to afford a property at market entry level price. This means that 60% of households are priced out of the market. This percentage varies from area to area from the highest percentage in Pen Llŷn, where 73% are priced out of the market, to the lowest in Ffestiniog at 42%.
Conwy and Denbighshire PSB – Assessment of local well-being 2017
At April 2016 the average house price for a property in Conwy CB was £145,450. This is currently 6.1 times the average household income of £23,750. This suggests that entering the housing market as a home owner is well out of the reach of the average household
Snowdonia National Park Authority Joint Housing Land Availability Study
2012/13
Completions: 57
Affordable units*: 37
2013/14
Completions: 28
Affordable units*: 10
2014/15
Completions: 58
Affordable units*: 27
2015/16
Completions: 18
Affordable units*: 3
2016/17
Completions: 20
Affordable units*: 9
*Part of total number
As can be seen from the table above the number of completions in the National Park has fluctuated from year to year therefore it’s very difficult to determine any specific trend. The low number of affordable units completed between 2015 and 2017 reflects the low number of completions for the same period. The low number of completions may be due to the difficult borrowing environment and the continuing gradual reduction of social housing grant. The Authority monitors the Eryri Local Development Plan annually and is in the process of revising the housing policies to ensure that sufficient land is available to be brought forward for development.
Tenure
All categories: Tenure
Eryri: 11,944
Pembrokshire Coast: 10,227
Brecon Beacons: 14,579
Wales: 1,302,676
Owned: Owned outright
Eryri: 49.6%
Pembrokshire Coast: 48.6%
Brecon Beacons: 44.4%
Wales: 35.4%
Owned: Owned with a mortgage or loan
Eryri: 22.7%
Pembrokshire Coast: 22.7%
Brecon Beacons: 26.3%
Wales: 32%
Shared ownership (part owned and part rented)
Eryri: 0.4%
Pembrokshire Coast: 0.3%
Brecon Beacons: 0.3%
Wales: 0.3%
Social rented: Rented from council (Local Authority)
Eryri: 4.9%
Pembrokshire Coast: 8.2%
Brecon Beacons: 8%
Wales: 9.8%
Social rented: Other
Eryri: 6.3%
Pembrokshire Coast: 3.2%
Brecon Beacons: 5.7%
Wales: 6.6%
Private rented: Private landlord or letting agency
Eryri: 10.9%
Pembrokshire Coast: 12.3%
Brecon Beacons: 10.7%
Wales: 12.7%
Private rented: Other
Eryri: 2.3%
Pembrokshire Coast: 2%
Brecon Beacons: 2.4%
Wales: 1.5%
Living rent free
Eryri: 2.8%
Pembrokshire Coast: 2.7%
Brecon Beacons: 2.1%
Wales: 1.6%
Eryri National Park had the highest percentage of households which are owned outright at 49.6%. This was slightly more than Pembrokeshire but significantly higher than the national percentage of 35.4%.
All of the National Parks were beneath the national average of 9.8% in terms of households rented from the relevant local authorities. Eryri National Park was a great deal less with only 4.9% of households rented from the local authorities.
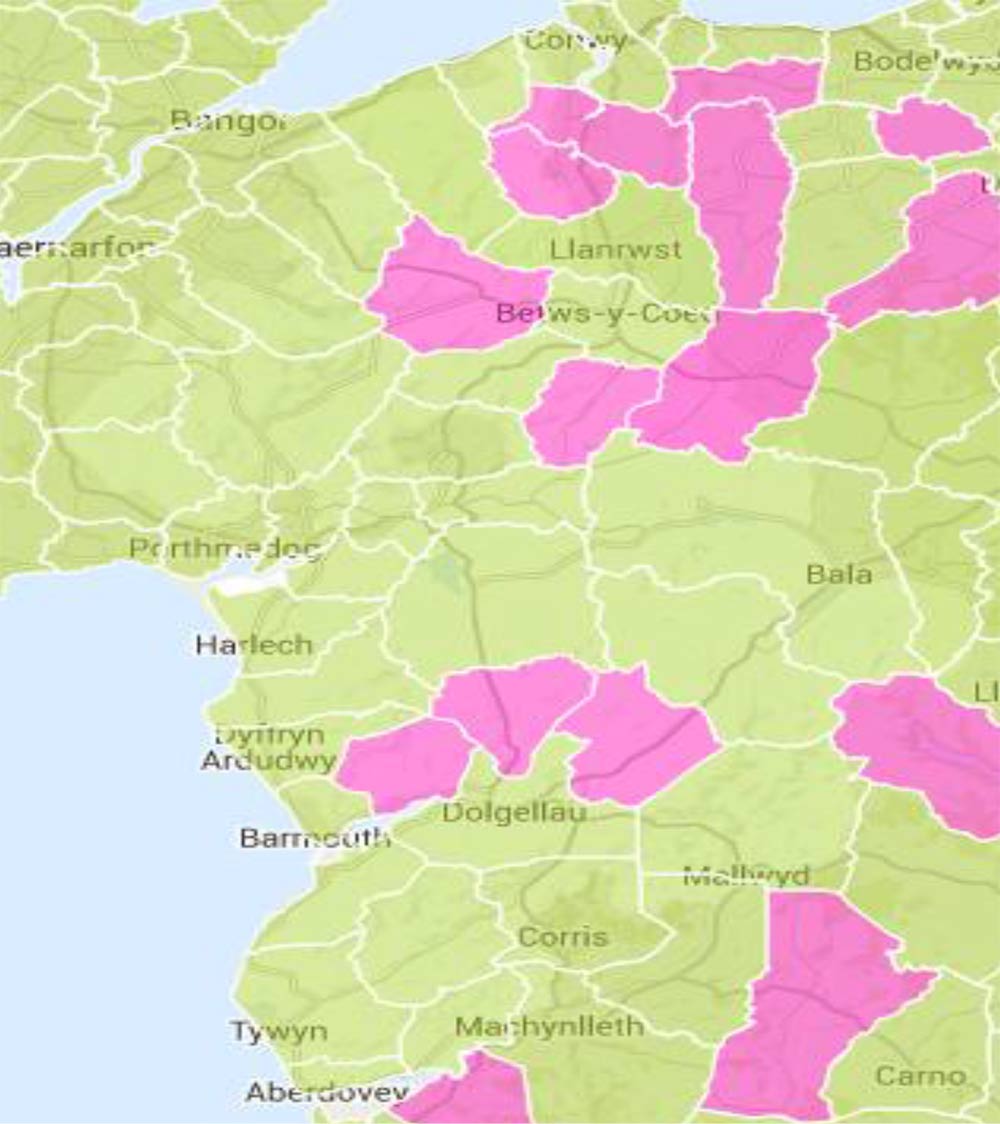
Superfast Broadband
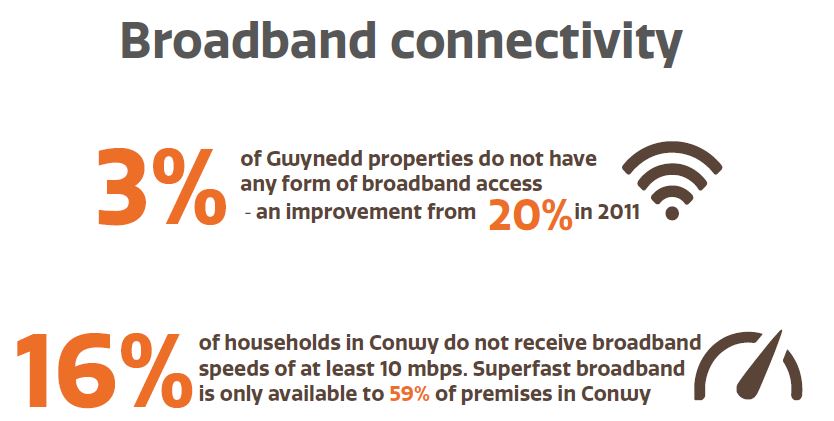
The Welsh Government’s Superfast Cymru programme aims to deliver access to superfast broadband to the majority of homes and businesses in Wales.
With the assistance of European funding together with public and the private sector has ensured a significant level of investment in the programme which is reckoned to be the largest partnership of its kind currently in the UK and a major infrastructure investment.
The introduction of a high speed broadband to rural areas on a large scale is a large and complex engineering task. The programme requires around 3,000 new fibre broadband cabinets and some 17,500km of fibre optic cable to bring superfast broadband to Wales.
The Welsh Government considers that Superfast Cymru is set to transform the broadband landscape in Wales and will promote economic growth and sustainable jobs in Wales. It has estimated that up to 2,500 further full times jobs could be created over time and it will ensure that Wales is at the forefront of the global digital economy and as a great place to live, work, invest and visit.
Most exchanges in Eryri, apart from a handful (shaded pink in the map below), have by now been upgraded to superfast broadband with the remaining handful of exchanges scheduled for upgrading in 2016.