Headline Steam Figures 2015
Eryri National Park prides itself on being a special part of the country where people come to relax and enjoy a wide range of leisure activities in spectacular surroundings. Tourism and recreation have become a major contributor to the economy and employment within Eryri National Park. Both are vital aspects of the future for the Park’s economy and wellbeing.
Tourist Expenditure (indexed prices)
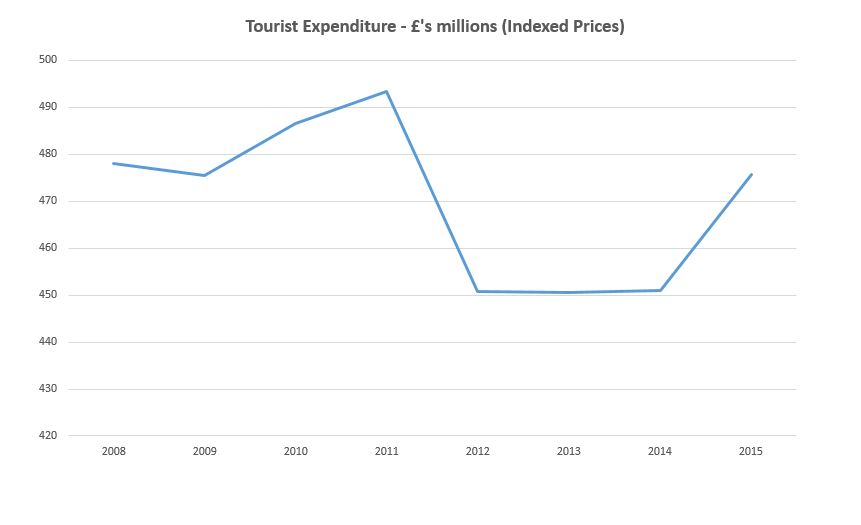
According to the 2015 STEAM figures (produced for the National Park Authority), the total tourist expenditure was £475.7 million (indexed prices).
This figure has increased significantly since 2012, although the 2015 figure is below the peak level of £493m seen in 2011. There was a decrease seen in 2012; a trend also seen in other tourism specific datasets within this section. Possible reasons for this sudden dip could include the fact that April and June 2012 were the wettest they had been since records began, with flooding throughout Wales during June. Additionally, July had below average levels of sunshine and above average levels of rainfall.
There was a slight increase (5.5%) in visitor expenditure between 2014 and 2015.
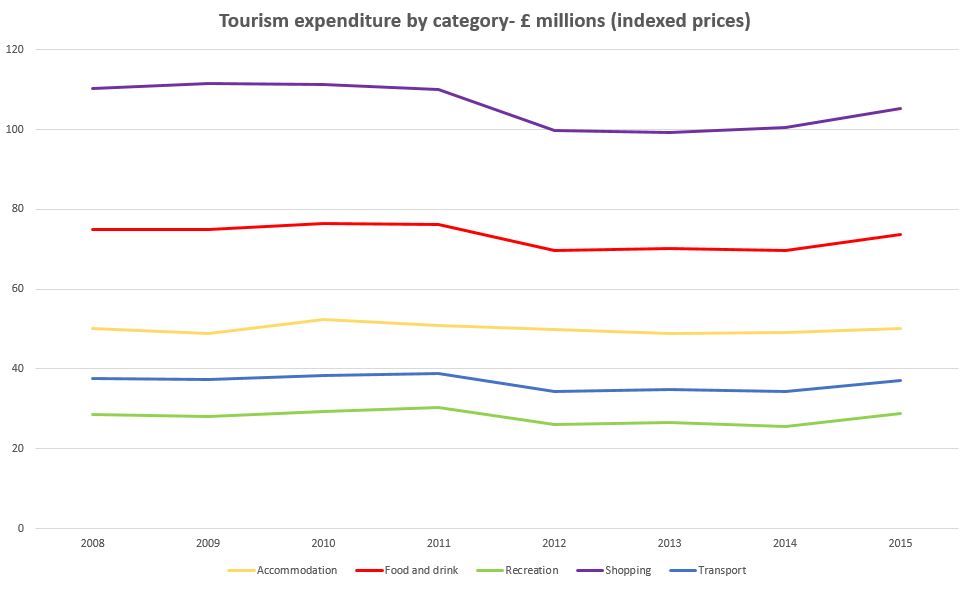
Tourist Expenditure by Category
The chart below gives a breakdown of tourist expenditure in Eryri National Park and shows that the most valuable tourist sector is the shopping sector. This resulted in expenditure of around £105 million in 2015, which was an increase of 4.8% from 2014 figures.
The breakdown of expenditure categories within the National Park, for 2015 is shown below.
Expenditure categories within the National Park 2015
Indirect expenditure
Actual total: £121.7 million
Increase/decrease from 2014: +5.1%
Shopping
Actual total: £105.35 million
Increase/decrease from 2014: +4.8%
Food and drink
Actual total: £73.7 million
Increase/decrease from 2014: +5.8%
VAT
Actual total: £59 million
Increase/decrease from 2014: +5.6%
Accommodation
Actual total: £50.1 million
Increase/decrease from 2014: +2.1%
Transport
Actual total: £37.1 million
Increase/decrease from 2014: +7.9%
Recreation
Actual total: £28.7 million
Increase/decrease from 2014: +11.9%
Although it was not the highest grossing sector in terms of expenditure, the ‘recreation’ sector saw the highest percentage growth between its respective 2014 and 2015 levels with an increase of 11.9%. Possible reasons for this could be due to the increasing levels of recreational activities available to tourist in and around the Park (for example Bounce Below, Zip World, Tree Top Adventures, Surf Snowdonia, new mountain biking paths etc).
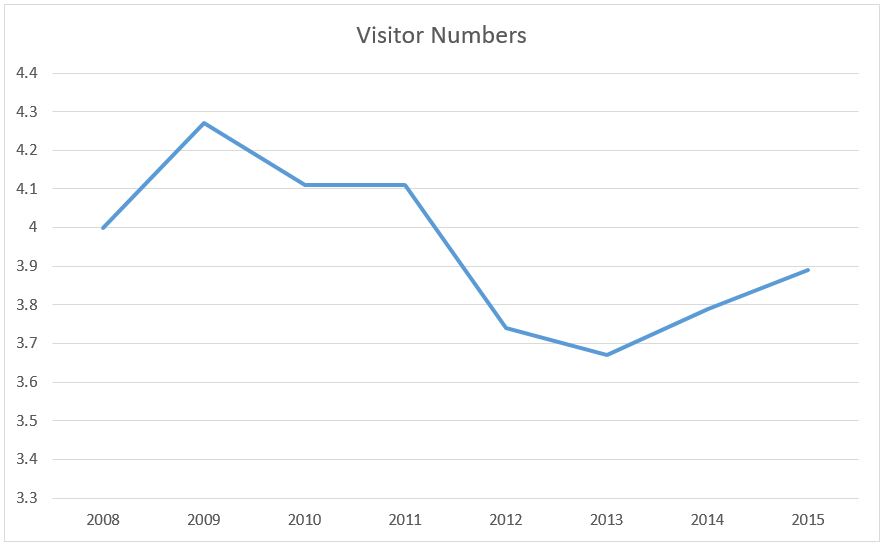
Visitor Numbers
STEAM figures indicate that there were 3.89 million visitors to Eryri National Park in 2015.This number is lower than the 4.27 million visitors to the Park in 2009. This means that there has been a 9.8% reduction in visitor numbers between 2009 and 2015 figures. However, visitor numbers have been increasing since 2013. The infographic below summarises visitor numbers information for the National Park according to the 2015 STEAM data.
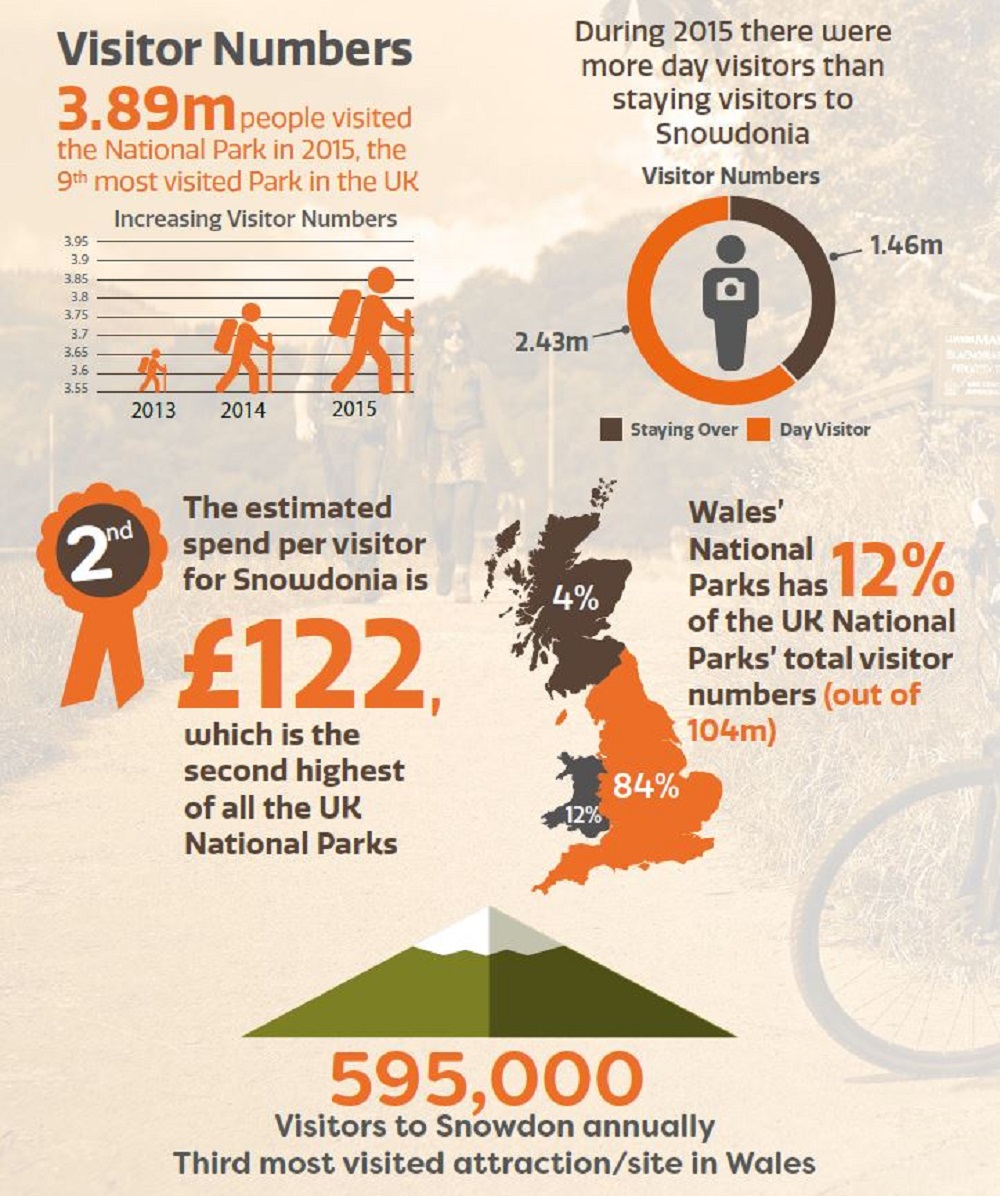
Visitor numbers by visitor type
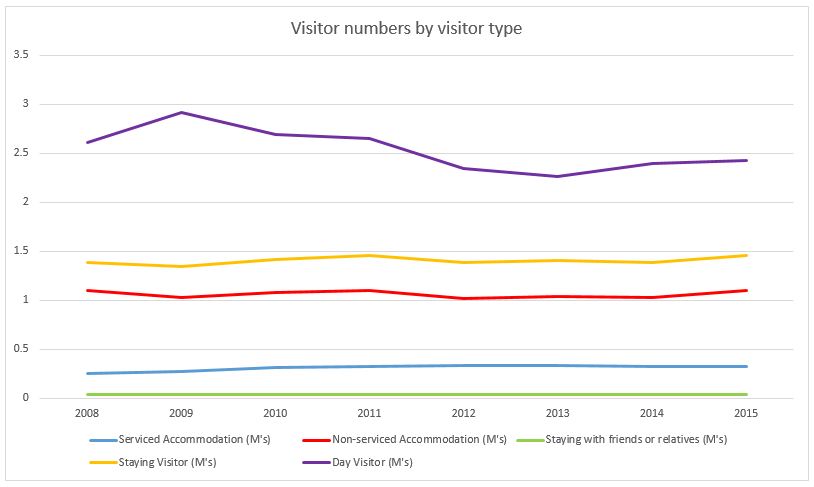
Figures indicate that visitor numbers, who are staying visitors or visitors staying in serviced or non-serviced accommodation, have slightly increased since 2013. The dip seen in 2012 and between 2012 and 2013 could be attributed to many reasons. April and June 2012 were the wettest they had been since records began, with flooding throughout Wales during June. Additionally, July had below average levels of sunshine and above average levels of rainfall.
Since 2009 there had been a reduction in visitor numbers classed as day visitors up until 2013, however since then numbers have steadily increased in this category.
Number of visitor days spent in Eryri National Park
The chart below illustrates that there were approximately 10.25 million tourist days spent in the National Park in 2015. Between 2008 and 2015 it is estimated that around 81.1 million tourist days had been spent in Eryri.
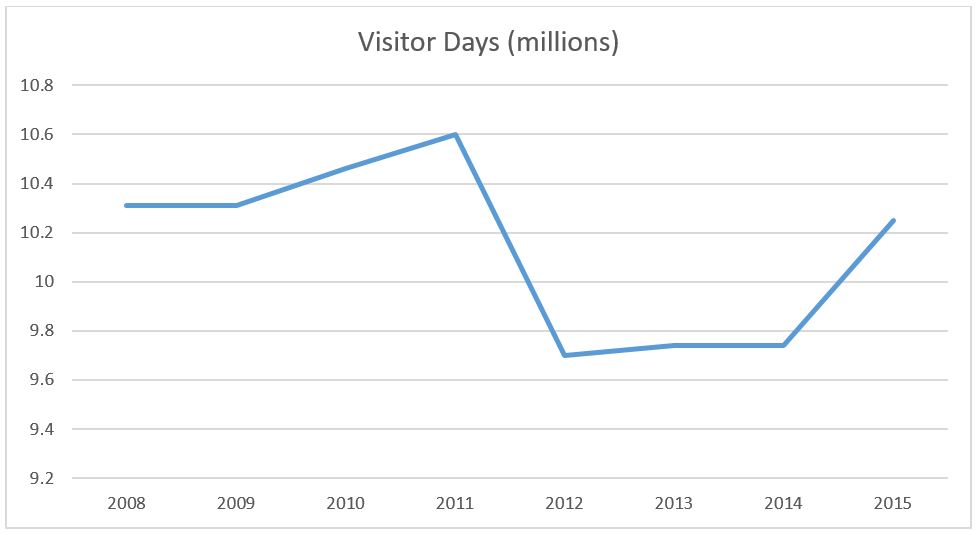
Following the trend seen with visitor numbers, visitor days also decreased after 2011 until 2014. In this instance however visitor days increased between 2009 and 2011, before a substantial decrease between 2011 and 2012. As mentioned previously, this dip could be attributed to many reasons. April and June 2012 were the wettest they had been since records began, with flooding throughout Wales during June. Additionally, July had below average levels of sunshine and above average levels of rainfall.
There was a slight increase (0.4%) in visitor days between 2012 and 2013 before a 5.2% increase between 2014 and 2015.
Visitor days by visitor type
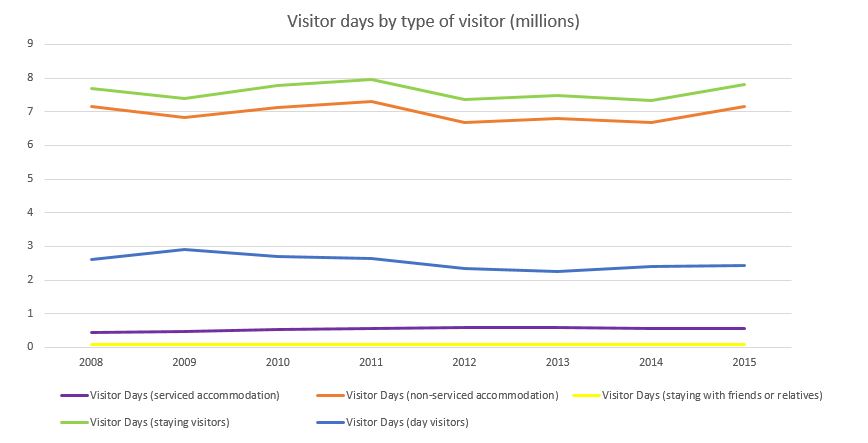
The trends seen in figure (for staying visitors or visitors staying in serviced or non- serviced accommodation) can also be seen for visitor days. However the number of visitor days, in terms of day visitors, decreased by 4% between 2012 and 2013.
Visitor days by visitor type in 2015
Serviced Accommodation
Actual total (millions): 0.564
Increase/decrease from 2014: -1.3%
Non-serviced Accommodation
Actual total (millions): 7.16
Increase/decrease from 2014: +7.3%
Staying with friends or relatives
Actual total (millions): 0.095
Increase/decrease from 2014: 0%
Staying visitor
Actual total (millions): 7.82
Increase/decrease from 2014: +6.5%
Day visitor
Actual total (millions): 2.43
Increase/decrease from 2014: +1.3%
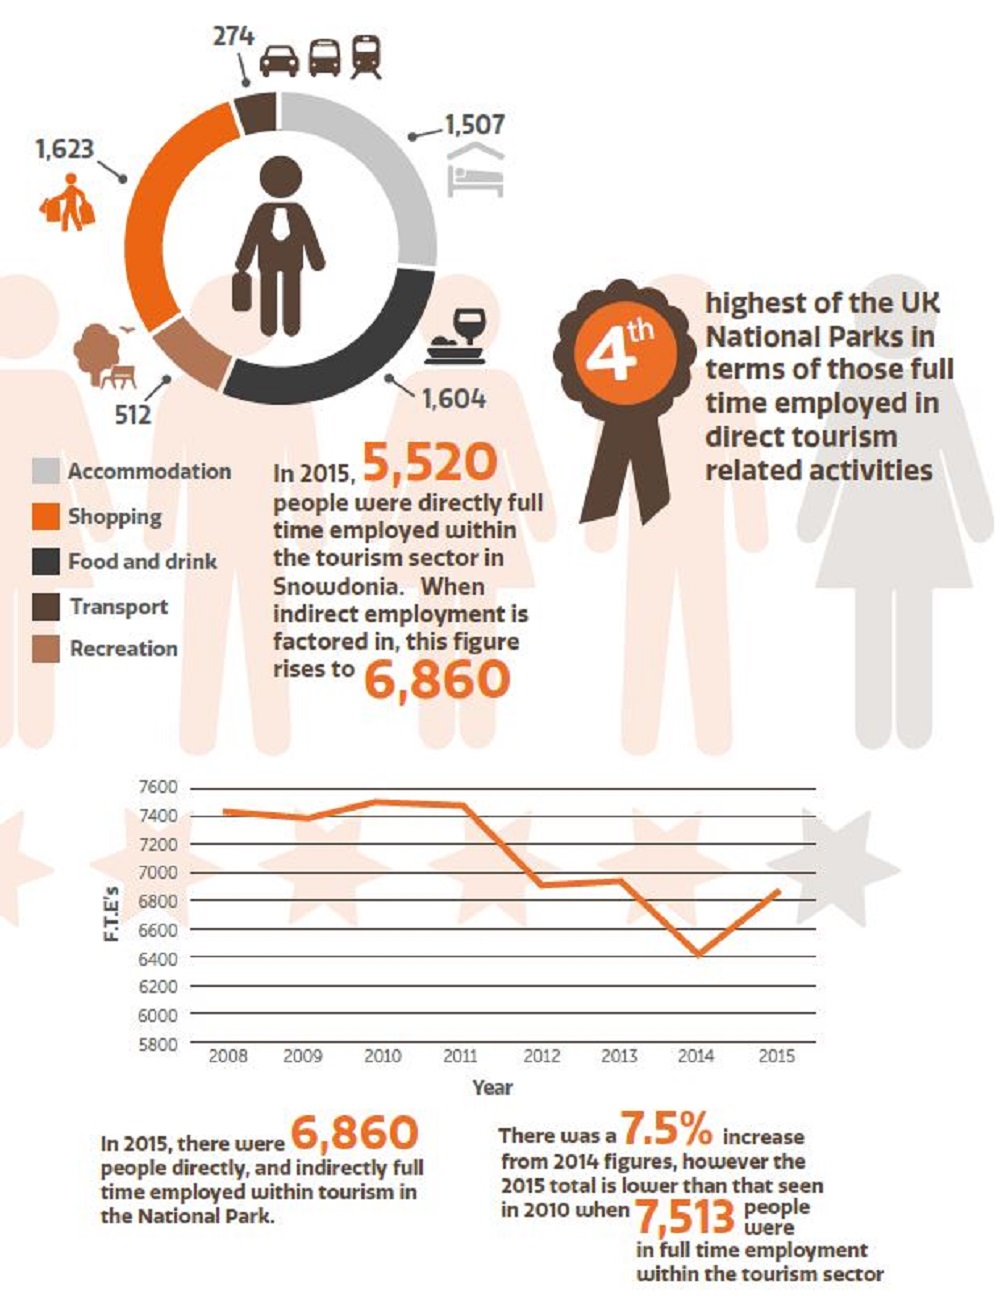
Employment in Tourism and Recreation
Employment in the National Park today is characterised by a strong reliance on a limited range of activities, in particular the service sector, agriculture and tourism.
The STEAM Surveys carried out annually in North Wales provide a range of information on tourism in the National Park including Employment in Tourism and Visitor Expenditure. The infographic below summarises the employment data, within tourism, for the National Park.